Showing posts with label Influence. Show all posts

Tuesday, 24 October 2017

Jost Hochuli: In Conversation


Jost Hochuli
Jost Hochuli, the renowned book designer, graphic designer, typographer, printer and author of Designing Books, and Detail in Typography has had a slow but steady impact on modern book design and typography. First, through his work, especially that for VGS and Typotron; then through his teaching at the Schüle für Gestaltung in St. Gallen; and more widely through his publications on typography and book design.

Through these books, especially the English language edition of Designing Books, he has become probably the most influential theorist of book design since Jan Tschichold.

Jost’s belief is that book design is not just concerned with beautiful objects, but rather it is about making useful tools for reading.

Apprenticed to Rudolf Hostettler at Zollikofer Verlag (publishing company) in the 1950’s, anecdotally only two typefaces were permitted in the works – Akzidenz Grotesk and Times New Roman. Working in the modernist style known as Swiss or International school, the goal of the apprentice typographer was to simplify page design and layout so that there was no typographic ‘noise’.

Although we think of the Swiss school as being the dominant style in Europe in the fifties and sixties, in fact it was largely confined to Holland, Germany and the German-speaking part of Switzerland. Even within Switzerland, designers in the French-speaking cantons looked to France and Didot, designers in the Italian-speaking cantons to Milan and Bodoni.

Nevertheless, the Swiss school, following the path laid down by the Bauhaus architect, industrial designer and typographer Max Bill won worldwide recognition in the decades following the Second World War

“We were simply louder” said Hochuli.

Bill urged Swiss designers to follow modernist “‘asymmetric’ or organically formed typography”, to reject “the conventional text-image of axial symmetry”.

In response, contemporary designer Jan Tschichold defended the need to design some books “in the manner of traditional typography” while allowing that others might be more suitable done in Bill’s ‘functional’ typography.


As Hochuli developed his style, he was influenced by Tschichold’s plea for “the right to work in the way that I find best”, whether ‘newly revived traditional typography’ or ‘functional typography’.

Although Tschichold never visited the Zollikofer works, Hostettler considering him “A traitor to modernism”, Hochuli followed a middle path between the modernism of the Bauhaus and die neue typographie and traditional book design, before ultimately rejecting the rigidity of the grid.


Preferring to use consistent channels of white space between elements to create harmony on the page, Hochuli’s graphic design practice aimed to capture the feeling of the work through typographic layout that created “adventures on a page”.

Thus echoing the principle ‘form follows function’, Hochuli’s preference is for content to come before design, although, as Hochuli has reiterated on several occasions, the designer must not follow dogma.

--

Jost Hochuli was in conversation with Tony Pritchard, LCC senior lecturer and ISTD board member.

In association with International Society of Typographic Designers, London College of Communication, Presence Switzerland and the Swiss Cultural Fund.


Wednesday, 4 October 2017

1,516 mass shootings in 1,735 days

1,516 mass shootings in 1,735 days: America's gun crisis – in one chart

The attack at a country music festival in Las Vegas on Monday 2 October 2017 that left at least 58 people dead is the deadliest mass shooting in modern US history – but there were six other mass shootings in America in the previous week alone.

Data compiled by the Gun Violence Archive reveals a shocking human toll: there is a mass shooting – defined as four or more people shot in one incident, not including the shooter – every nine out of 10 days on average.

The graphic, produced by The Guardian US interactive team, a small group of designers, interactive developers and journalists working alongside the editorial team, is horrifying in it's simplicity.


A simple but effective idea demonstrating the power of information graphics to tell a story. As you scroll down, the enormity of the carnage over the last four years becomes apparent, leaving you slack-jawed at the seemingly never-ending toll - an infinite scroll of injury and death.

Thursday, 21 September 2017

Can Graphic Design Save Your Life?

And so to the Wellcome Collection, and their exploration of the relationship between graphic design and health Can Graphic Design Save Your Life?.

The exhibition highlights the widespread and yet subliminal nature of graphic design in constructing and communicating healthcare messages; words and images, signs and symbols, colour, scale and format, all carefully structured to communicate, and in doing so shaping our environment, society and personal health.

Creating a health message that an individual is willing to self-identify with, and consequently inspire action or change their behavior, requires a range of design interventions. Surprisingly, sometimes a small structural change can create the greatest impact.

For example, ‘nudge’ theory suggests that presenting people with a mandated choice or opt-out question makes it significantly more likely that they would choose to carry an organ Donor card.

The exhibition is divided into zones; persuasion, education, hospitalisation, medication, contagion and provocation.

Each of which explain one aspect of design in health, from national public awareness campaigns such as those for AIDS (TBWA) and the Samaritans (BBDO), to design research such as the NPSA’s findings on improving pharmaceutical packaging design and patient safety (RCA’s Helen Hamlyn Centre for Design).

I enjoyed seeing Dr. John Snow’s historic map of cholera deaths around the Broad street pump, and Florence Nightingale’s ‘rose’ charts to illustrate deaths from disease in the Crimea, classics of information design.

On a larger scale, the sympathetic A&E information and wayfinding system for the NHS (Pearson Lloyd) and the now ubiquitous emergency service ‘battenburg’ patterns (PSDB) are reminders of how effective design ideas quickly spread and become an accepted part of the environment.

Whether taking the correct tablet, deciding to donate an organ or to practice safe sex, graphic design influences our health and wellbeing. Can Graphic Design Save Your Life? considers just how vital graphic design can be.


Saturday, 19 November 2016

Type talks

We know that typefaces convey emotion as well as information.

Sarah Hyndman’s talk at the Museum of Packaging set out to explore the connections between social change, popular sentiment and typography.

In a time of increased industrialisation and globalisation, where jobs and livelihoods are threatened, where an influx of labour from elsewhere depresses wages, where old certainties are stripped away as financial systems, social order, and country borders are threatened. New leaders articulate a radical vision of the future, whilst those outside of the elite look on powerless and in search of a voice.

Sound familiar?

In 1970 the raw anger of a generation that felt excluded, marginalised and ignored found their voice in Punk. Expressed through attitude, music, style and typography, Punk’s anti-establishment stance found its visual expression through the work of Jamie Reid.

The stylistic conventions of Punk included mixing type styles and weights, overprinting, cluttered pages, deliberate mistakes, cultural references, blurred photography and an embrace of general messiness. All elements that rejected the rules and structure of the international style, took the typographic grids of modernism, a visual shorthand for the corporate industrial complex, and tore them apart.

Treating type as if it was a photograph freed designers from the restrictions of typesetting within a structured grid. Cut-out, photocopied and hand-drawn type also had the advantage of being able to bypass expensive printers, the rawness of the layouts on labels, flyers and zines perfectly matching the urgency and language of the authors.

 Ironically, the vibrancy of the look led to it becoming co-opted by the very establishment that Punk aimed to subvert. First ignored and feared, then embraced and tamed.

Kellog’s Squares anyone?

The creation of an expressive style that symbolises opposition to the establishment has historical precedent, and the inevitable co-option of anti-establishment typography into the mainstream follows a similar pattern. First World War Germany saw the appearance of Dadism. 1960’s America brought us psychedelia and pop art against the backdrop of the Vietnam war. The industrial decline of The UK in the 1970’s gave rise to Punk, whilst the 1980’s brought New wave and the postmodern typographic design of Brody, Saville, 8vo and Tomato (amongst others).

And so to 2016, and the rise of the Snapchat generation. With one typeface, limited tools and only a 10 second viewing window, Snapchat is the latest medium for millennials to share the moments that matter to them. it’s really immediate and ugly. You’re not designing, it’s just Times New Roman or Ariel and then it’s gone. It’s the closest thing now to how Punk looked like then.

Unstructured information and emotion that is explicitly short-lived and self-deleting, so it can’t be filtered, searched, indexed or saved, but provides today's authentic voice.

Tuesday, 22 September 2015

The joy of timesheets

Timesheets. We all hate them. We’ve all got to do them.

Why can’t we just get on with being creative?

But we need to remember that design is a business, and like any other business, to be able to stay in business, we need to remain solvent.

Unlike manufacturing where you can measure the number of units produced, and then price them accordingly to cover your costs, as a professional service we creatives can only charge for our time.

Only if we know the value of our time can we know whether we’re working efficiently, and only if we know how efficiently we work, can we know how much time to allocate to a project.

Allocating time to a project, and thus knowing when we’re under budget and when we’re over budget is the difference between profit and loss.

And measuring time also provides structure to our day, telling us when we’re over-servicing a demanding client (so maybe we should talk about additional fees), and when we can afford to go the extra mile (maybe to help build a relationship with a new client).

Measuring time also informs our professional development by telling us when we’re taking a bit too long to do something, maybe something that requires new software, or more training, or could be passed to a junior, or should be outsourced to a specialist?

So for example, my local garage charges me £25/hour to service my car. I could do it at home, but I haven’t got the right kit, it means getting a bit oily, two trips to a parts supplier and most of Saturday afternoon spent lying in gravel.

Assuming the average design freelance rate of £36/hr, clearly it’s more cost effective to outsource the work to a specialist. However, if I do the work myself (for my own satisfaction), at least I’m doing it in the knowledge that I’m making a small loss (but maybe acquiring new kit and developing a new skill in the process).

It’s an informed cost/benefit business decision that is only made possible thanks to timesheets.

Love ‘em.

Wednesday, 13 May 2015

Google Mobile App UX Principles

I do like a good UX framework, and Google’sMobile App UX Principles document uses practical examples to demonstrate how to improve the user experience of apps. The effectiveness of user optimisation strategies are illustrated using metrics such as app performance and user conversion on both Android and iOS platforms.

Adopt, Use, Transact, Return
In designing an app, you need to work hard to meet the expectations of users who are becoming accustomed to high quality apps that deliver usable, robust, and sometimes delightful user experiences.

Investing time and effort in creating, testing and optimising services can have a significant effect on how ‘sticky’ your app becomes.

The basics that need to addressed include optimising conversion, and avoiding interrupting users, or forcing them to think about things that should be simple. Google expresses this as a four-stage ‘Adopt, Use, Transact, Return’ framework.

Adopt, Use, Transact, Return

Adopt - Remove roadblocks to usage  
Remove all roadblocks to usage - and adoption - of your mobile app. Get users into the content / substance as quickly as possible, so that they can use, assess and experience its value to them.

First impressions count, and a splash screen gives you a short but vital window to engage a user in your proposition. But, never make users wait.

Tips / help or an onboarding sequence should only be employed if really necessary - so as not to interrupt users - but when used appropriately at key decision points, tips/help can guide the user in their initial experience and adoption.

Use - Make conversion decisions simple  
Enable people to use your app in the way that suits their needs. A clear structure combined with an excellent search facility using a range of methods, from keyword to product scanning and image search, will help users find what they want quickly and easily, satisfy their needs and drive conversion.

Transact - Provide the ultimate in convenience
Help users progress through each checkout stage with minimal effort, and with sufficient reassurance, to convert without hesitation.

Return - Self service, engagement and delight
Be useful, to engage and delight, in order to retain customers or encourage member loyalty. Because, mobile apps are the most appropriate touchpoint for repeat interactions and frequent transactions, customers and members already loyal to a brand, and mobile first use cases (that couldn’t exist without unique smartphone services leveraging rich and contextual data; etc.), are more likely to return if an app provides an engaging experience.


What not to do


Do not mimic UI elements from other Platforms 
Design for each native mobile platform – Android and iOS - because each has unique capabilities and visual languages

Do not use underlined links 
Avoid using text with underlined links, which are part of the web / browser / page model, and not part of the app / screen model. Apps use buttons, not links.

Do not take users to the browser
Keep users in-app at all times, to maintain their spatial geography and to optimise conversion.

Do not ask users to rate your app too soon after downloading it
Avoid interrupting users by asking them to rate your app if they’ve only recently downloaded it or only used it a few times. Instead, wait until they prove to be repeat users and they’ll be more likely to rate your app favourably and provide more informed feedback

Friday, 16 January 2015

Are Annoyingly Literal Headlines Set In Title Case Optimised For SEO?

You can find them across the web, headlines written for search engines rather than readers.

Online magazines like DesignTaxi and news aggregator sites such as BuzzFeed and Huffinton Post use strangely formulaic headlines, typically including a keyword, a proper noun, a verb, and an adjective whilst avoiding simple connectives. It’s English, but not as we know it. In SEO terms the language is optimised to add ‘value’ to each headline.

But in writing for robots, you just get robotic headlines.

It’s hard to imagine classic newspaper headlines such as the Sun’s 1992 headline ‘GOTCHA’ having the same impact as ‘Royal Navy Stealth Submarine Sinks Argentinian Cruiser in South Atlantic’.

Probably the best (worst?) example is the Daily Mail Online, where the inclusion of multiple keywords in the headline means the headlines have become almost as long as the stories themselves. It's clickbait in its purest form. The logical conclusion of this process is that the headline becomes the story, just a shrieking top-line opinion seeking an instinctive knee-jerk reaction from the comment trolls.

Surely we can write better than this.

The point of SEO is to provide sufficient context for search engines to rank the story as high as possible in the search results, relative to the value of the content.

Whilst search engine algorithms are constantly being tweaked, it’s generally accepted that an editor can improve the page ranking of a story by crafting the relationship between the headline, page title and meta description.

As well as describing the story, the title needs to include a proper name and a likely keyword that the reader might be using in their search (towards the front of the headline if possible). The page title can expand on the headline, for instance using a full name when the headline just uses a shorter, well-known, shorthand (eg. Diana / Diana, Princess of Wales), whilst the meta description can include more detail for the ‘snippet’ displayed underneath the link in the search results. All three elements should aim to match the words that users are likely to use in their search, and these search-optimised keywords should also be included in the opening paragraph of the story.

Thinking more widely about the utility of the headline, fitting it within 156 characters to read fully in the search results makes it easier to circulate on social networks, and including a personal pronoun in the headline also improves the chances of readers sharing your story.

(There are of course other factors in SEO, such as unique links to the story and referring links from the story, but these are not necessarily part of the headline construction).

In 2009, usability expert Jakob Nielsen introduced the concept of writing short, snappy SEO friendly headlines that “…must be absolutely clear when taken out of context” and cited the BBC's website as a best practice example of headline-writing “…offering remarkable headline usability."

Nielsen claimed that BBC headlines have the following characteristics:
  • Short, typically 5 words or less
  • Information-rich
  • Include keywords
  • Understandable, even out of context 
  • Predictable/match for reader expectations
On the other hand, headlines from viral sites are usually the complete opposite:
  • Long, sometimes to the point of being rambling and incoherent
  • Emotion-rich
  • Few or no keywords
  • Typically non-contextual
  • Use shock or emotional language
And whilst there is value in using searchable terms, the results can be lost in translation.

The late advertising and copywriting genius, David Ogilvy, said that "On average, five times as many people read the headline as read the body copy.”

The point of a headline is to draw the reader into a story that they might not otherwise have read. The skill of the web subeditor is in knowing their audience so well that they can add their editorial tone of voice to the headline, whilst still capturing the imagination of the reader.

And if you can turn your headline into a pun, then so much the better.

The Scottish Sun’s ‘Super Caley go ballistic Celtic are atrocious’ is held up as one of the all time classic newspaper headlines.

And, although no one knew it at the time, it’s SEO friendly.

Monday, 22 September 2014

Big design

gov.uk
When the award-winning gov.uk site launched in 2012, it marked the moment ‘big design’ entered the mainstream.

Driven partly by the need to be accessible, and partly by the requirement to work on mobile devices, the launch of gov.uk also coincided with the design industry moving from skeuomorphic design towards the flat aesthetic seen in Microsoft’s Windows 8 ‘Metro’ interface, Apples iOS8 and Google’s Materials Design.

This combination of HTML5 dynamic backgrounds, overlayed with large type and control icons on flat colour panels has created a youthful ‘flat’ UI design meme that references the Bauhaus and Swiss Design schools and provides a single underlying system providing a unified experience across platforms and device sizes.

The new BBC responsive website, now in beta testing, follows the same principles.


BBC Beta

Every week, the BBC News website gets around 115 million visits, and the number coming from mobiles and tablets is increasing all the time to the point that these devices now account for 43% of unique browsers.

Looking at device usage, it seems clear that the increased take up of tablet and mobile devices, with their requirement for larger button target areas, is driving the move towards ‘big design’.


Apple iOS7
For any organisation, maintaining different versions of websites for desktop, tablet and mobile (as well as accounting for different screen sizes, different browsers and legacy systems) is unsustainable. Designing simpler responsive sites, optimised for different screen sizes, is the most efficient structure, but it means that control areas designed for display on mobile devices take up a proportionally larger area of screen when displayed on a desktop device.


Microsoft Metro/Windows8
Google Material Design
This also represents a shift in the way websites are designed. In the early days of the web, websites were merely ‘brochureware’ extensions of printed publications. (The first web page I designed for the DTI just had a telephone number on it.) Then came sites that replicated the (sometimes labyrinthine) internal structure of an organisation. In the third wave these sites were turned around to be more user-centric.

Now we are seeing the rise of more focused task-centric sites, and enabling users to carry out these tasks (often on the move) using a simple graphic UI that stands out from the background visual noise is a major driver in big design.

But in deploying large blocks within your content, the challenge now for a designer is how to develop the visual structure without losing a sense of style.

The resolution of mobile screens means that good typography, tracked and spaced with as much precision as print, is now achievable. Icons and other UI elements don’t need candy stripes or glossy reflections to make them look better at low resolutions.

So while it’s good to know what best-practice is, it’s possible for designers to push the boundaries, because we can.


Tuesday, 29 April 2014

Just what was it about Richard Hamilton?

Just what is it that makes today’s homes so different,
so appealing?
Visiting the retrospective of Richard Hamilton at Tate Modern, I was struck by the way he constantly embraced new ideas in his art, and experimented with different drawing, painting, collage and printmaking methods and latterly digital techniques.

Hamilton took a very experimental approach to art, exploring the boundary between figurative and abstract images and the interface between organic and industrial forms.

In 1951, for his exhibition Growth and Form at the ICA, Hamilton used grid-based structures to look at form in nature and explore their influence on design trends in contemporary architecture and design.

In the seminal 1955 Man, Machine and Motion exhibition at the Hatton Gallery in Newcastle and then at the ICA, Hamilton arranged around 200 images in a modular steel grid. The viewer was encouraged to explore the installation and see images around, above and below them.

His developing interest in popular culture led to the creation of the collage seen as the first Pop art work, Just what is it that makes today’s homes so different, so appealing? Hamilton listed the characteristics of Pop art;
  • designed for a mass audience
  • transient
  • expendable
  • low cost
  • mass produced
  • young
  • witty
  • sexy
  • gimmicky
  • glamorous
  • big business
Effectively he was describing the next 50 years of modern advertising.


Thursday, 17 April 2014

Heartbleed

It's a simple logo for a complex bug. But creating an identity to raise awareness is entirely the point.

You’ve probably never heard of CVE-2014-0160. But you probably have heard of the Heartbleed bug, the security hole in some implementations of the OpenSSL protocol that provides secure communication between servers.

The two are one and the same, except that CVE-2014-0160 is the name assigned under the Standard for Information Security Vulnerability Names protocol, wheras Heartbleed is a catchy, scary name with a catchy, scary logo depicting a red heart. Bleeding.

The power of the Heartbleed logo is in its sheer, bold literalness, and in that regard it’s perfect for its purpose.

Heartbleed was given its identity by the international security company Codenomicon, which independently discovered the CVE-2014-0160 OpenSSL exploit on the same day as Google researcher Neel Mehta.

Most security holes like CVE-2014-0160 would be posted on messageboards read only by the coding and hacking community, but in this case Heartbleed was so serious that everyone who uses OpenSSL in applications such as web, email and instant messaging was at potential risk of having their passwords compromised.

A Codenomicon engineer came up with the name Heartbleed, inspired by a tangentially related piece of software called Heartbeat, and in a brilliantly inspired piece of marketing, Codenomicon registered Heartbleed.com, designed an FAQ explaining the bug, and accompanied it with a logo by Codenomicon designer Leena Snidate.

The logo went viral and the Heartbleed brand was born.

Don’t be surprised if the next major bug also gets its own name and logo™ and probably a clothing range.

Monday, 24 March 2014

A structured identity for the Brecon Beacons


The Brecon Beacons is an area famed for its exceptional natural beauty, wide open hillsides and natural light. It is also designated as a ‘dark sky’ area with little or no light pollution.

In 2010 Visit Wales designated the Brecon Beacons as a national park, and Small Back Room were asked to create a new brand for the Brecon Beacons, basing the designs around the ideas of light and the thought ‘Our National Park’.

Taking the idea of light as central to the branding, the logo contains two intersecting lines that create a triangle or cone of light, which creates an underlying structure that influences the visual language of the brand. For example, the cone can be used as a supergraphic.

I like the idea of supergraphics that stem from the core brand. I first became aware of this when working with the Department of Health (DH) brand, where a segment of the DH arc is used as a container for images.

But supergraphics are not limited to print.

Taken to an extreme, the shard-like visual language developed by FutureBrand from the construction lines for the 2012 London Olympic logo, were used to create environmental graphics that could be expressed on a huge scale, for example as seating patterns in the Olympic stadium and pool.

You can imagine the same principles being used to influence the environmental design for visitor centres, signage and events like Brecon Jazz.

The Brecon Beacons brand is designed to be bilingual, and the brand colour palette is extended to enable the brand to be used as flexibly as possible.

The website will launch in April, and stakeholders will be able to download digital assets to apply the brand locally. I hope they're able to imagine the possibilities and to use it well.

Tuesday, 19 November 2013

Investing in design

Design Council research has shown that for every £1 that businesses invest in design, they gain on average over £4 net operating profit, over £20 net turnover and over £5 net exports.

And there is increasingly widespread awareness in industry that when the remit for design is widened beyond the traditional focus on products or graphics to provide benefits such as improved strategic thinking, morale and productivity, then design can add significant value to organisations.

A new report, Leading Business by Design, suggests that rather than being a method solely for creating desirable objects, design can be fundamental to businesses in helping them innovate and define strategy.

The report was commissioned from Warwick Business School by the Design Council, and came up with three main findings;
  1. Design is customer-centred – Benefit is greatest when design is intimately related to solving customers’ problems.
  2. Design is most powerful when culturally embedded – It works best when it has strong support from senior management in the commissioning organisation, and is integrated into product / service development from beginning to end.
  3. Design can add value to any organisation – Design can benefit small, medium or large manufacturing and service-based organisations by driving innovation and opening up uncontested market spaces, differentiating products and services to attract customers, and improving recognition by strengthening branding to embody a company’s values.
Using case studies, the report provides practical examples of how these three design themes have benefited a range of organisations, and provides clear evidence that structured design thinking offers a set of widely applicable principles that can be of huge benefit to all businesses.

Essentially, it suggests that rather than being a method solely for creating desirable objects, design can be fundamental to businesses in helping them innovate and to define strategy.

Tuesday, 5 November 2013

Less than one second


Paul Butt / Section Design
Structuring and visualising data is a discipline that always appeals to me, so it was with a sense of anticipation that I took a trip to Shoreditch to see a two-day exhibiton of information and data design curated by London based information design agency, Signal Noise.

Signal Noise commissioned a series of print-based data visualisations that explored the theme of “less than one second”, based on the premise that time is of the essence now more than ever before.

We now access enormous reams of data in ‘less than a second’, thanks to technologies such as cameras that captures the movement of light in slow motion, or the Large Hadron Collider (LHC) that observes sub-atomic activity happening in millionths of a second.

Technology enables a vast number of data points and events to be read and understood across a variety of fields - from automated trades to F1 analytics - but filtering and making sense of the data so that it provides a useful insight is the job of the information graphic designer.

Despite the wide range of subjects used as source material for the exhibition, including athletics, cinematography, F1, GPS, the LHC and stock trading, I found it significant that the base structure of the majority of the visualisations was circular.


Mapping the data - Josh Gowen
The visualisations that eschewed circles were, I thought, less intuitive and less visually attractive, even though timelines are traditionally depicted as, well, a line.

Imposing a clock face metaphor seemed to provide a familiar ‘carrier’ structure for the message, enabling the viewer to quickly interpret the information.

The most successful visualisation seemed to me to be Josh Gowen’s ‘Mapping the data’, combining the clock metaphor with the shape of the LHC and a graphic that showed how the volume of data crunched by the LHC is filtered and then delivered to 151 research centres worldwide.

Telling the story by combining seven pieces of information in one graphic, plus some cool stats. What's not to like?

Sunday, 27 October 2013

Phonebloks

On Tuesday 29th October the Phonebloks video will ping across social networks 375 million times.

Phonebloks is a new concept for a mobile phone with a replaceable screen and easily moveable, changeable “bloks”, each containing a different element such as battery, chipset, gyroscope and so on that would give users a chance to choose from a range of components, and replace or upgrade them when necessary.

A phone only lasts a couple of years before it breaks or becomes obsolete. Although it’s often just one part that killed it, we throw everything away because it’s almost impossible to repair or upgrade.

The idea, by Dutch designer Dave Hakkens, came about when Hakkens realised that if a device could be taken apart and restructured more easily it would last much longer (and minimise electrical waste).

And so the idea of Phonebloks was born.

Phoneblok is made of detachable bloks. The bloks are connected to the base which locks everything together into a solid phone. If a blok breaks you can easily replace it; if it’s getting old just upgrade.

Bloks can be developed for specific needs. Solar powered batteries, sensitive screen for blind people, lightweight for travelers etc.

“Let’s say this is your phone and you do everything in the cloud - why not replace your storage blok with a bigger battery blok?” says Hakkens. “If you’re like this guy and love to take pictures, why not upgrade your camera?”

The bloks themselves would be available from a ‘Blokstore’, like an app store for hardware. In the store you buy your bloks, read reviews and sell old bloks. Small and big companies develop and sell their bloks. You can buy a pre-assembled phone or assemble it yourself by selecting the brands you want to support. The choice is yours.

And the platform can be adapted into other sizes to create new devices like tablets, cameras etc.

But at the moment, it’s just an idea.

For Phonebloks to happen, it totally depends on companies thinking there is a market for it, so the more people that are interested, the sooner companies start working on it.

Thursday, 26 September 2013

Unbuntu open source font project

Following on from Bruno Maag's presentation on fonts and branding, I wanted to find out more about Dalton Maag's Unbuntu* open source font project.

Unbuntu is a free to use open source operating system developed by Canonical.  What sets Unbuntu apart from other open source projects is the aim of creating for the user a friendly and consistent experience from code to graphical user interface (GUI) to print.

Part of Canonical’s design philosophy is to ensure that users can use programs in their own language, so the font used for the operating system (OS) needed to work across a range of character sets including Arabic, Cyrillic, Greek, Hebrew and Latin and is designed so it can be extended to include other languages including Chinese, Indian and Thai.

Establishing the nature of a font requires a structured design framework to inform each stage. The difference with this project was the involvement of the Open Source community throughout – essential to influence the process and confer a sense of ownership. The design process had to be completely transparent with a flow of information in both directions.

As a core part of the Unbuntu brand identity, the new typeface needed to embody the Unbuntu values of clarity, lightness and simplicity, so early in the design process Dalton Maag established that a humanist sans serif was the most appropriate look and feel for the font.

This decision was in part dictated by the required functionality of the OS; the need for the font to work on screen at small sizes meant avoiding anything too elaborate or too wide.

Humanist fonts have their roots in early round hand calligraphy, and are seen as friendly, warm and highly legible. The clean lines and large x-height of a sans serif help with on screen readability, print well and have a contemporary feel.

The initial concepts were designed using a small number of glyphs, but enough to be able to create test copy, and get a good idea of what the finished design would look and feel like. Beginning with the Latin, Dalton Maag started designing with the four letters, n o H O, and these glyphs helped to define a guide for around 80 percent of the remaining character set.  The distinctive shapes for the ‘n’ and ‘v’ and a slight curvature to the ascenders and descenders helped establish the overall personality of the font. These unique design features would be translated across all the character sets to ensure that the design was a complete and consistent family.

The final font design includes four weights from light to bold plus their italics, a monospace font and a condensed regular.

The italic versions were designed as true italics where the a,e,f and g have different shapes that add subtle emphasis and textural difference to the roman text.

The designers also needed to consider the spacing between letters, as this creates a natural rhythm in the text that helps the reader to read with ease and understand the message. Manual adjustments, including kerning pairs, were addressed to ensure that the finished look was aesthetically pleasing.
Cultural sensitivities and nuances also needed to be taken into account for the left to right reading Arabic and Hebrew fonts. Arabic glyphs are derived from one another, but change meaning with the addition of diacritics, whilst Hebrew letterforms have a squarer feel and ‘hang’ from the x-height rather then sitting on the baseline.

Dalton Maag’s engineering team then performed a complex process to ensure that the font rendered on screen correctly. This included a checking and verification process to make sure that it met TrueType specifications, the addition of Unicode system information to identify each glyph co-ordinated across all the font styles and weights, and extensive manual hinting to make the font appear faithfully at any resolution on any device.

Finally the fonts were tested in a number of different environments and applications to check that they behaved as intended before being released.

The final design is a beautiful example of typographic design. It gives shape to the Open Source philosophy of Ubuntu, whilst remaining functional and aesthetically pleasing.

Exhibited in the Design Museum, the Unbuntu font family is a practical example of how a the partnership between the Open Source community and professional type designers can use the power of design to produce something valuable for everyone to use.


*Unbuntu is named after the Southern African philosophy of ubuntu, which often is translated as “humanity towards others” or “the belief in a universal bond of sharing that connects all humanity”.

Wednesday, 14 September 2011

Designing Simplicity

Making life simpler, easier and less stressful. Aren’t these a big part of what good design can do to help us live well? 

Designing Simplicity was the first in a series of Inspire + Connect evening events organised by the Design Council Challenges team.

The speakers were Sam Hecht, co-founder of Industrial Facility, whose ethos of striving for simplicity has led to more user friendly products, and Dan Thompson, founder of the Empty Shops Network, and the instigator of the recent #riotcleanup efforts in London.

Sam talked about his design process - removing unnecessary layers so that the function of an object is simple and clear. But he also recognised that everything is a product, that every product is part of a system, and that every system exists in an environment.

The design does not stop at the edges of the object, but is an extension of the whole.

Dan is not a designer, but he facilitates activities and change by the simplest means possible. In the case of #riotcleanup, an idea, a mobile phone, a twitter account, a memorable hashtag and a broom.

In the first 24hrs of #riotcleanup, 87,000 twitter followers believed that they could make a difference. The key was simplicity - a straightforward, practical action using basic equipment meant a low barrier to entry.

Both speakers demonstrated that a structured approach to designing simplicity can produce incredibly effective results.

Thursday, 28 April 2011

Wim Crouwel at the Design Museum

If you get the chance, take an afternoon out to visit the Design Museum where the Wim Crouwel retrospective is showing until July.

Regarded as one of the leading designers of the twentieth century, Crouwel embraced modernist principles, producing a wide range of typographic designs that influenced the course of graphic design through the 50s and 60s and continues to have resonance today.

Heavily influenced by the Bauhaus and the modernist design work of Jan Tischold and Josef Muller-Brockmann, Crouwel’s initial work as an exhibition designer gave him a great sense of spatial awareness that he brought to his poster and programme designs, first for the Van Abbe Museum in Eindhoven, and later for the Stedelijk Museum in Amsterdam.

Wim Crouwel's work at the Design Museum
Gifted with a sympathetic museum director who allowed him the freedom to develop a signature look, Crouwel developed a structured grid system which acted as a unique template for the Stedelijk Museum's graphic identity. The logic of his designs distil the subject down to its absolute essence, yet often the poster layouts contain an experimental element or visual pun, playing off the exhibition title or the subject artist's style.

In 1963 Crouwel founded the multi-disciplinary design agency Total Design creating the identity for numerous Dutch companies, working for clients such as IBM, and typeface commissions for Olivetti. He was instrumental in leading a controversial redesign of the dutch telephone book using only lowercase letters - offering major savings on ink and paper - but one which failed to find favour with its audience.

New Alphabet (redrawn)
Whereas his strength lay in designing one-off grid-based posters and wordmarks, primarily supported by easily readable sans serif type, his interest in letterforms as graphic objects led Crouwel to design the radical New Alphabet typeface as a visual experiment. Based on the look of type as seen in emerging computer systems, it appeared almost alien, a cipher script of vertical and horizontal lines. This almost Illegible font challenged the design establishment and provoked debate amongst modernists - a debate which Crouwel was happy to engage in - openly admitting to placing visual aesthetics above function.

(Although never meant to be really used, New Alphabet was subsequently redrawn by Brett Wickens and Peter Saville for the Joy Division album, ‘Substance’ in the late 80s.)

Some of his work has dated, but there are many pieces that still retain a freshness and vitality and demonstrate a clarity of thought. Set beside contemporary work by design groups 8vo, Cartlidge Levine, Studio Myerscough and Peter Saville, the influence and legacy of Wim Crouwel can be clearly seen.

Tuesday, 15 March 2011

Bass notes: Saul Bass at London's Kemistry Gallery

Saul Bass is acknowledged as one of the 20th century’s most successful corporate designers, responsible for (amongst others) the logos and identity systems for AT&T, United Airlines, Alcoa and Warner Communications.

Bass’s work is instantly recognisable for its directness, its simplicity and the way it makes its meaning felt. Breaking all conventions in the 1950s and 60s, Bass virtually invented film titles as we know them today, and he was the first to synthesize movies into compelling trademark images.

Looking at his poster designs on display at the Kemistry Gallery, I wondered how much his style was driven by the silk screen process and the need to reduce the visual idea down to it's simplest, most expressive components.

His later posters were more colourful and visually complex, yet seemed to have less impact.

In a period when graphic imagery can be easily manipulated electronically, Bass reminds us that to cut through the visual clutter, a strong idea is always at the heart of a great design.

Tuesday, 1 March 2011

Creative clusters and innovation

Putting creativity on the map

NESTA research report 2010

NESTA is the National Endowment for Science, Technology and the Arts - an independent body with a mission to make the UK more innovative. NESTA invests in early-stage companies, informs policy, and delivers practical programmes that inspire others to solve the big challenges of the future.

Their report into Creative Clusters, published in November 2010 makes interesting reading for both businesses looking to foster creativity within their organisations, as well as policy makers and planners looking at creativity locally and nationally.

The creative industries are a force for innovation at the national, regional and organisational level. At 6.2 per cent of the economy, and growing at twice the rate of other sectors, the economic importance of the creative industries to the UK are proportionately the largest of any in the world. Nurturing high-technology clusters can also be seen as a way of rebalancing the economy away from the construction and financial services sectors.

The UKs creative industries are more innovative than many other high-innovation sectors, providing a disproportionate number of the innovative businesses in most parts of the country. Analysis of the innovation performance of Britain’s creative industries confirms that they punch well above their weight in terms of innovation across almost all regions in the UK.

NESTA took the concept of creative clusters as a starting point to examine the role that creative industries play in local and regional innovation systems.

Industrial clustering benefits businesses by giving them access to skilled staff and shared services, and the opportunity to capture valuable knowledge spillovers.

Creative firms tend to locate close to each other even more than
most other sectors. Advertising and Software firms often cluster near each other; the same is true of Music, Film, Publishing and Radio and TV businesses.
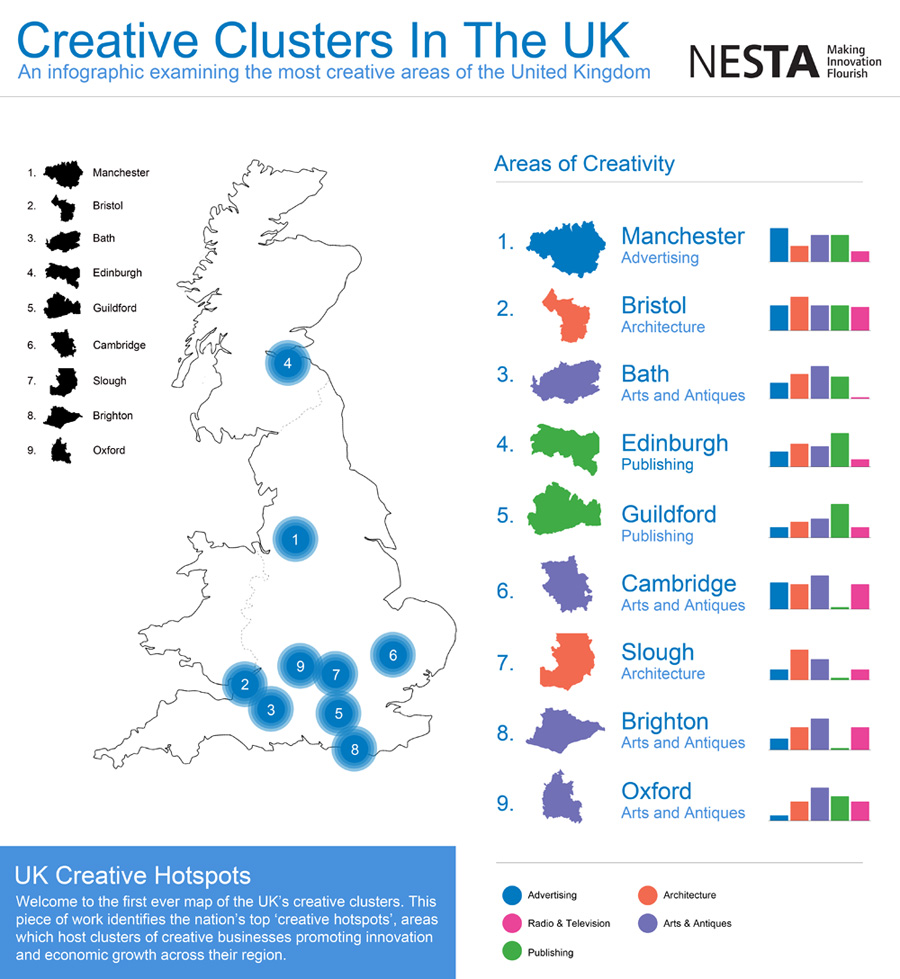
Creative hotspots
London is at the heart of the creative industries in Britain, dominating in almost all creative sectors, and particularly in the most intrinsically creative layers of the value chain for each sector.

The nine other creative hotspots across Britain are Bath, Brighton, Bristol, Cambridge, Guildford, Edinburgh, Manchester, Oxford and Wycombe-Slough.

Different cities across Britain have different profiles of creative specialisation: cities across the South present more diversity in their range of creative services, whereas Northern and Midlands cities (Manchester excepted) have similar creative profiles.

However, the mere existence of a creative agglomeration is not enough for the benefits from clustering to emerge. The other crucial ingredient is connectivity between firms within a cluster, with collaborators, business partners and sources of innovation elsewhere (both in the UK and overseas), and finally, with firms in other sectors that can act as clients, and as a source of new and unexpected ideas and knowledge. These three layers of connectivity are underpinned by a dense web of informal interactions and networking.

NESTA’s report identified a range of proactive steps that can be taken to help boost creativity internally, locally and nationally;

Look for latent clusters rather than try to build new ones from scratch
Identify whether there are any latent clusters ‘hidden’ in your locality that would benefit from networking and awareness-raising to develop a dense web of internal and external links.

Think about which sectors work well together
There are important synergies between some creative sectors, but not others. Avoid potentially wasteful ‘one-size-fits-all’ strategies for creative clusters that don’t pay sufficient attention to the distinctive needs of different sectors.

Adopt better targeted, and more realistic strategies that focus on ‘building up and connecting’ those sectors that are already present – and are complementary with each other.

Technological innovation is increasing the potential impacts from the creative industries…
The creative industries do not have a monopoly on creativity, but neither do manufacturing and engineering have a monopoly on technological innovation.

Universities should do more to promote innovation in increasingly tech-intensive creative industries
Technology intensive creative industries, for example, have something to gain from tapping into the public research base in their local universities.

In the context of the creative industries, universities tend to be seen mainly as a source of skilled labour. This contrasts with the technology and science-based sectors, where universities are a crucial source of knowledge for innovation, as well as high-growth spinoffs. It is important to ensure that the local creative industries engage more actively with universities to harness research outputs that might enhance their productivity and innovative performance.

Nurture talent, and give it reasons to stay
The presence of a specialised and knowledge-intensive pool of labour is a key factor in business.

Help remove barriers to collaboration
Even if they are aware of each other, local creative businesses may be keen to protect their valuable ideas or client portfolios and be wary of collaborating for fear of disclosing sensitive information.

Capture creative value locally

The generation of original intellectual property (IP) is at the core of what many creative businesses do. Where they retain ownership over their IP, they have more incentives to innovate to exploit it, generating additional revenues that can be reinvested in growth, and building commercial and collaborative relationships with other local firms.

Build bridges as well as towers
Although investments in iconic public buildings can produce undoubted cultural and economic benefits, building links between potentially collaborative businesses and sectors may produce longer lasting impacts.

East London Tech City as the beginning of a new approach for creative cluster development?
The Prime Minister’s announcement (in November 2010) of the East London Tech City set of initiatives, aimed at building up the vibrant high-tech and digital media cluster in Old Street and Shoreditch is a step in the right direction. Rather than trying to create a new cluster from scratch, East London Tech City aims to take an organic, already competitive cluster to the next level, by providing it with the right infrastructure (both physical and digital), and developing its connections with global companies.

Wednesday, 19 January 2011

This is Tomorrow

And so to the Whitechapel Gallery to see This is Tomorrow, an account of the production process of this seminal exhibition.

During the 1950s mass production and new technologies were celebrated by the Media. Novel materials were to influence all areas of life, from the daily maintenance of living spaces and the built environment as well as the production of art.

Architect, writer and founder member of Pentagram Theo Crosby’s initial idea for an exhibition involving architects, artists, designers and theorists resulted in This is Tomorrow, which took place at the Whitechapel in 1956 in collaboration with members of the Independent Group. The theme was the ‘modern’ way of living and the exhibition was based on a model of collaborative art practice. The 38 participants formed 12 groups, which worked towards producing one artwork.

Just What Is It that Makes Today’s Homes So Different,
So Appealing? © Whitechapel Gallery
  
One of the group members, Richard Hamilton, produced his 1956 collage Just What Is It that Makes Today’s Homes So Different, So Appealing? for the exhibition. It is considered by critics and historians to be one of the early works of Pop Art.

An iconic show in its conception and realisation it has continuously interested artists, theorists and curators ever since due to the challenge it posed for the creative practitioners and visitors alike. The former, as each group was formed by an architect, a designer, an artist and a theorist, were requested to amalgamate their individual approaches and produce a work by deploying a new methodology. The public, with no interpretation panels and other information available, had to make their own judgements as to how to navigate inside the gallery and interpret the works they viewed.